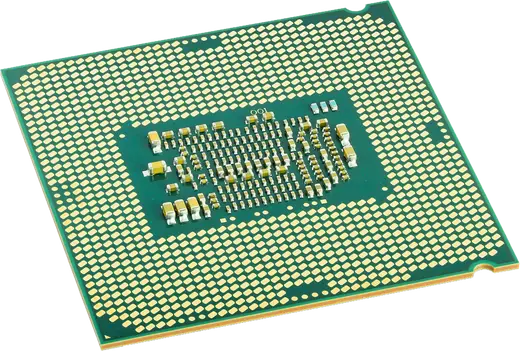
A bottleneck calculator tells you which part of a gaming PC runs out of speed first. Every frame needs work from both chips: the processor (CPU) runs the game and prepares each frame, then the graphics card (GPU) draws it. If the processor cannot keep up, you have a CPU bottleneck and an expensive graphics card sits waiting. If the graphics card is the slower part, you have a GPU bottleneck, which is normal and usually what you want. This PC bottleneck calculator estimates both limits from our own performance tables for your resolution, the kind of games you play and your monitor's refresh rate, then says what to upgrade first and when not to upgrade at all. It is an estimate rather than a bottleneck test of your own machine, so the guide below also shows how to confirm the answer on your PC in a few minutes.
How does a bottleneck calculator work?
This one gives each part a ceiling: the most frames per second it could deliver if the other part were infinitely fast. Whichever ceiling is lower is the frame rate you can expect, and that part limits first.
- Processor ceiling. It comes from the processor's single-core speed and its core count in our table, the same table the Can my PC run it check uses. It barely changes with resolution, because game logic, physics and draw calls cost the same at 1080p and at 4K.
- Graphics card ceiling. It comes from the card's score in our table, where a GeForce GTX 1060 6GB is 100, divided by the work the resolution adds. Compared with 1080p, 1440p costs about 1.45 times the work, 3440 x 1440 about 1.75 times and 4K about 2.45 times. That is less than the pixel count suggests, because geometry and some effects cost the same at any resolution. Upscaling renders fewer pixels and lowers the cost.
- The kind of game. Esports titles at low settings run at hundreds of frames per second and lean hard on the processor. AAA games at high settings load the graphics card far more. Mixed use keeps a stream or other apps running, so more processor cores count.
Worked example: Ryzen 5 3600 with a GeForce RTX 4090
In AAA games the Ryzen 5 3600 tops out around 115 fps in our model. The RTX 4090 could draw about 260 fps at 1080p, 180 at 1440p and 105 at 4K. At 1080p the card would be busy only about 45% of the time and wait for the processor the rest: a strong CPU bottleneck. At 4K the two ceilings are within about 10% of each other, so the same pair is balanced there. Same parts, opposite answers. That is why the calculator shows every resolution at once instead of one number.
How to check for a bottleneck: step by step
Step 1: Pick your processor and graphics card
Click a box to open the full list, grouped by series with the newest first, or type part of a name such as 12400F or 4060. On a computer, the page offers the graphics card your browser reports as a one-click suggestion. Browsers never share the processor model, so pick that one yourself.
Step 2: Choose your resolution and the kind of games you play
Pick 1080p, 1440p, 3440 x 1440 ultrawide or 4K. Under More options, pick esports for high frame rate shooters, AAA for big single-player games at high settings (the default), or mixed if you stream or keep apps open while you play.
Step 3: Add your refresh rate and RAM
Also under More options, set your monitor's refresh rate as the frame rate target, so the advice knows when a part is already fast enough. RAM is optional; under 16 GB the advice says so.
Step 4: Read which part limits first at each resolution
The result appears once both parts are picked. The sentence and the two bars are for your resolution, and the shorter bar is the part that limits first. Compare all resolutions shows how the answer changes from 1080p to 4K, and the advice says what to upgrade, or why not to.
Step 5: Confirm it on your own PC
Play a demanding scene with a performance overlay on. GPU usage of 95% or more means the graphics card limits; clearly lower usage with no frame cap points to the processor.
Not sure of your refresh rate? Measure it with the refresh rate test, and check your screen resolution while you are at it.
Why one bottleneck percentage misleads
Most bottleneck calculators print a single figure, such as "18% CPU bottleneck", as if it had been measured. One number hides almost everything that decides the answer:
- Resolution flips it. The worked example above is CPU limited at 1080p and balanced at 4K with exactly the same parts.
- The game flips it. Strategy games, simulators and big multiplayer matches load the processor far more than a cinematic single-player game. One PC can be CPU limited in one game and GPU limited in the next on the same evening.
- Your target decides whether it matters. A processor that tops out at 140 fps is plenty on a 60 Hz or 120 Hz screen and holds you back on a 240 Hz one. A bottleneck you cannot see on your monitor is not worth money.
- Some bottleneck is always there. Every PC has a part that reaches its limit first, so 0% does not exist. A GPU-bound PC, where the graphics card works at full load, is the goal, not a fault.
- False precision. A figure like 23.7% suggests accuracy that no performance table has. We round to 5% and call anything within about 15% balanced, because the scores themselves are only accurate to around 10%.
So the calculator answers three questions instead: which part limits first, at which resolutions, and whether that matters for the frame rate you want.
Bottleneck examples: common CPU and GPU pairings
These verdicts come from the same model as the calculator, for AAA games at 1080p, 1440p and 4K, plus esports games at 1080p. Click a pair to open it in the calculator.
| Processor and graphics card | AAA 1080p | AAA 1440p | AAA 4K | Esports 1080p |
|---|---|---|---|---|
| Ryzen 5 3600 + GeForce RTX 4090 | Strong CPU bottleneckGPU usage about 45% | CPU bottleneckGPU usage about 65% | BalancedWithin about 10% | Strong CPU bottleneckGPU usage about 25% |
| Core i9-14900K + GeForce GTX 1650 | GPU bottleneckCPU headroom about 85% | GPU bottleneckCPU headroom about 90% | GPU bottleneckCPU headroom about 95% | GPU bottleneckCPU headroom about 75% |
| Ryzen 7 7800X3D + GeForce RTX 4070 | Balanced, GPU-boundCPU headroom about 35% | Balanced, GPU-boundCPU headroom about 55% | GPU bottleneckCPU headroom about 75% | BalancedWithin about 10% |
| Core i5-12400F + GeForce RTX 3060 | Balanced, GPU-boundCPU headroom about 50% | GPU bottleneckCPU headroom about 65% | GPU bottleneckCPU headroom about 80% | Balanced, GPU-boundCPU headroom about 15% |
| Ryzen 5 5600 + GeForce RTX 4060 | Balanced, GPU-boundCPU headroom about 35% | Balanced, GPU-boundCPU headroom about 55% | GPU bottleneckCPU headroom about 75% | BalancedWithin about 5% |
| Ryzen 5 7600 + Radeon RX 9070 XT | Slight CPU bottleneckGPU usage about 85% | Balanced, GPU-boundCPU headroom about 20% | Balanced, GPU-boundCPU headroom about 50% | Strong CPU bottleneckGPU usage about 50% |
| Ryzen 7 9800X3D + GeForce RTX 5090 | CPU bottleneckGPU usage about 70% | BalancedWithin about 5% | Balanced, GPU-boundCPU headroom about 40% | Strong CPU bottleneckGPU usage about 40% |
| Core i7-8700K + GeForce RTX 3070 | BalancedWithin about 10% | Balanced, GPU-boundCPU headroom about 40% | GPU bottleneckCPU headroom about 65% | CPU bottleneckGPU usage about 65% |
| Ryzen 5 2600 + GeForce RTX 3060 Ti | BalancedWithin about 5% | Balanced, GPU-boundCPU headroom about 35% | GPU bottleneckCPU headroom about 60% | CPU bottleneckGPU usage about 60% |
| Core i5-13400F + Radeon RX 7800 XT | BalancedWithin about 10% | Balanced, GPU-boundCPU headroom about 35% | Balanced, GPU-boundCPU headroom about 65% | CPU bottleneckGPU usage about 65% |
| Ryzen 7 5800X3D + GeForce RTX 4070 SUPER | BalancedWithin about 5% | Balanced, GPU-boundCPU headroom about 35% | Balanced, GPU-boundCPU headroom about 60% | CPU bottleneckGPU usage about 65% |
| Core i5-4460 + GeForce GTX 1060 6GB | GPU bottleneckCPU headroom about 40% | GPU bottleneckCPU headroom about 60% | GPU bottleneckCPU headroom about 75% | BalancedWithin about 5% |
A few patterns stand out. The RTX 5090 is CPU limited at 1080p even with a Ryzen 7 9800X3D, the fastest gaming processor in our table, so cards of that class make the most sense at 1440p and 4K. Esports games shift every pair toward the processor compared with AAA games, because the graphics work per frame is light. And a mid-range card like the RTX 3060 or RTX 4060 with a recent six-core processor is GPU-bound in AAA games at every resolution, which is exactly what a sensible build looks like.
Why we built this bottleneck calculator
Most people who look up a bottleneck calculator are about to spend money: a new graphics card for an older processor, or a new pair of parts. The real question is whether the part they want will be held back, and whether they need to buy anything at all. A single percentage does not answer that, for the reasons in why one bottleneck percentage misleads.
Nitin Raja, who builds this site, tried the popular bottleneck calculators before building this one. Most give one number with no working, and the two busiest wrap the result in ads.
So we kept what a buyer needs and left the rest out: which part limits first at each resolution, how far apart the two parts are, whether that matters on your monitor, and a way to confirm it on your own PC. There are no ads or shop links on the page, and the hardware tables carry the date they were last checked, October 2026.
What this bottleneck calculator measures
Nothing is measured on your PC. The tool compares two estimates from our hardware tables, a processor ceiling and a graphics card ceiling. This is the whole method, as the code runs it.
| Input | What it changes in the estimate |
|---|---|
| Processor | The processor ceiling: single-core speed plus a bonus for cores |
| Graphics card | The graphics card ceiling: the card's score |
| Resolution | The graphics card ceiling only: 1440p costs about 1.45 times the work of 1080p, 3440 x 1440 1.75 times, 4K 2.45 times |
| Games | Both ceilings, how many cores count (8, or 12 with streaming) and the default target (144 fps for esports, 60 fps otherwise) |
| Refresh rate | The target, which decides whether the advice says to upgrade at all |
| Upscaling | Renders two thirds of the width and height, so 4K drops to about 1.55 times the work of 1080p |
| RAM | No ceiling. Under 16 GB the advice puts memory first |
The processor score
Single-thread speed (Core i7-4770K = 100) times the core count to the power 0.4, with a hyper-thread counting as 0.3 of a core. Doubling the cores adds only about 32%, because games lean on a few main threads, and cores beyond 8 (12 with streaming) do not count: a 16-core Ryzen 9 9950X scores 485 for AAA games and 570 with streaming. A factor per kind of game turns the score into frames per second. A Ryzen 5 3600 scores 273, about 115 fps in AAA games.
The graphics card score
The GeForce GTX 1060 6GB is 100, and laptop chips get their own, lower scores. The score times a factor per kind of game (0.40 fps per point for AAA, 0.65 for mixed, 1.70 for esports) is the 1080p ceiling. Higher resolutions divide it by the pixel count to the power 0.65, so 4K, with four times the pixels, costs about 2.45 times the work.
When we call it a bottleneck
The lower ceiling is your expected frame rate. When the graphics card ceiling is more than 15% higher, it is a CPU bottleneck: slight, then clear once 25% of the card sits idle, strong from 45%. Within 15% either way the pair is balanced, because the tables are only accurate to about 10%. A lower graphics card ceiling is normal (GPU-bound); we call it a GPU bottleneck only when it misses your target by more than 5%. If the limiting part already reaches your refresh rate, the advice says not to upgrade. Suggested upgrades are parts still sold new, at least 25% faster for graphics cards and 10% for processors.
Where the numbers come from, and what we do not measure
We compiled the tables by hand from manufacturers' spec sheets and the broad consensus of published benchmark reviews, then rounded them: 241 graphics cards and 181 processors, last checked in October 2026. Nothing is copied from another site's table. The factors were set so familiar parts land where reviews agree, such as a GeForce GTX 1060 6GB near 40 fps in recent AAA games at 1080p high.
We do not measure or model specific games, drivers, memory speed and timings, ray tracing, frame generation, thermal throttling, laptop power limits, background apps or 1% lows.
How accurate is this bottleneck calculator?
It is good at direction and rough size: which part limits first, how big the gap is, and how it moves with resolution. It is not a measurement. Two parts within about 10% of each other in our tables should be treated as the same class, and because the factors are averages for a kind of game, a single game can land at half or double the ceilings shown.
Treat a verdict within one step of the boundary, for example a slight CPU bottleneck next to balanced, as a coin toss that depends on the game. Treat a strong verdict as reliable. And when money is on the line, confirm it on your PC first.
How to test for a bottleneck on your own PC
A real bottleneck test takes a few minutes and needs only free tools.
- Turn on an overlay. MSI Afterburner with RivaTuner Statistics Server shows GPU usage, per-core CPU usage and frame rate in the corner of the game. Built-in options work too: the NVIDIA app overlay, the AMD Adrenalin metrics overlay, or the Windows Game Bar performance widget (Windows key and G). For frame times, Intel's free PresentMon also reports how busy the graphics card is on each frame, on any brand of card.
- Remove frame caps. Turn off V-Sync and any frame rate limit in the game or the driver for the test. A cap makes both parts look underused.
- Play a demanding, repeatable scene for a few minutes, such as a busy city or a large fight, not a menu.
- Read GPU usage. A steady 95% or more means the graphics card limits, which is normal. Clearly lower usage while the frame rate stays below your refresh rate means something else limits, usually the processor.
- Look at single cores, not the total. Games lean on a few threads, so total CPU usage can read 40% while the main thread is at 100%. In Task Manager, open Performance, right-click the CPU graph and choose Change graph to, Logical processors.
- Try the resolution test. Drop the resolution or render scale a step, or switch upscaling to Performance. If the frame rate barely rises, the processor limits. If it jumps, the graphics card does.
Frame rate is not everything: uneven frame times feel worse than a slightly lower steady rate. Our UFO test shows what different frame rates look like on your screen, and the input lag test measures how quickly a click reaches the display.
Why this calculator is different
We built it at testyoursetup.com because most bottleneck calculators print one unexplained percentage. Here is what it does instead, and you can check each point on this page:
- Every resolution side by side. 1080p, 1440p, 3440 x 1440 and 4K at once, because the same pair can flip from CPU limited to balanced.
- A labelled estimate with the method shown. The result says Estimated, and the section above gives every factor and threshold.
- It says when not to upgrade. When the limiting part already reaches your refresh rate, or the PC is GPU-bound as it should be.
- Current hardware. RTX 50, Radeon RX 9000, Arc B, Ryzen 9000 including the X3D chips, Core i9-14900KS and Core Ultra 200S, plus laptop chips, with the date the list was last checked shown on the tool.
- Browser detection, only when you want it. Where the browser shares your graphics card, the page offers it as a one-click suggestion, and the resolution starts at your screen's. You pick the processor, because browsers never report it.
- A self-test you can run. Step by step, with free tools named, so you can confirm the estimate on your own PC.
- No download, no account. A share link keeps your parts and settings in the address.
This bottleneck calculator vs typical bottleneck calculators
We looked at the bottleneck calculators that show up first in search in October 2026. They vary, so the right-hand column says "often" or "some" where that is the honest summary.
| This calculator | Typical bottleneck calculator | |
|---|---|---|
| Result | Which part limits first, a balance figure and rough ceilings for both parts | Usually one bottleneck percentage |
| Resolutions | 1080p, 1440p, ultrawide and 4K side by side | Often one resolution per run |
| Says it is an estimate | Yes, on the result and in the method above | Some do in an FAQ; some present the number as if measured |
| Method explained | Yes: the score references, the resolution factors, the core cap, the thresholds and what is left out | Some explain it; most give no formula |
| When not to upgrade | Says so when you already reach your refresh rate or the PC is GPU-bound | Varies |
| How to check on your PC | Step by step, with free tools named | Few name a tool |
| Hardware list | Includes RTX 50, Radeon RX 9000, Ryzen 9000 and Core Ultra 200S, plus laptop chips | Some lists stop at RTX 40 and 13th gen Core |
| Ads and shop links | None | Some carry ads, shop or affiliate links |
If you are not sure your PC meets a game's requirements at all, start with Can my PC run it, which checks 60 popular games against the same hardware tables. Planning a monitor upgrade instead? The monitor size calculator shows how big and sharp a screen really is.
Bottleneck calculator FAQ
What is a good bottleneck percentage?
Anything under about 15% is a well matched pair, because the performance tables behind any calculator are only accurate to around 10%. A large figure on the GPU side is fine too: it means the graphics card works at full load and the processor has room to spare, which is how a gaming PC should run. Only a large CPU-side figure means part of your graphics card goes unused.
Is a 10% bottleneck bad?
No. A 10% gap is within the error of the estimate and you would not notice it in play. Every PC has one part that reaches its limit first, so a bottleneck of 0% does not exist. Spend money only when the limiting part keeps you below the frame rate you want.
Can RAM cause a bottleneck?
Yes, but it looks different. Too little RAM causes stutter and long hitches rather than a steady lower frame rate: 41 of the 60 games in our requirements list recommend 16 GB or more. Slow or single channel memory also lowers frame rates where the processor limits, so use two sticks and turn on XMP or EXPO in the BIOS.
Can a monitor bottleneck a PC?
A monitor cannot slow the PC down, but it caps what you see: a 60 Hz screen shows at most 60 frames per second, however many the PC makes. If your frame rate is already above your refresh rate, a faster processor or graphics card changes nothing on that screen. Set your refresh rate in the calculator to see this.
What is the difference between CPU bound and GPU bound?
CPU bound means the processor cannot prepare frames fast enough, so the graphics card waits and shows low usage. GPU bound means the graphics card is busy all the time and sets the frame rate. Being GPU bound is normal and good; being badly CPU bound wastes graphics power.
Will upgrading my CPU increase my FPS?
Only if the processor is the part that limits. Check GPU usage while you play: if it stays at 95% or more, a faster processor adds little or nothing. If GPU usage drops well below that with no frame cap, a faster processor raises the frame rate, often most in the 1% lows.
Is a GPU bottleneck bad?
No. A GPU bottleneck means the graphics card runs at full load, which is what you paid for. It only matters when the frame rate is lower than you want, and then the fix is a faster graphics card, upscaling or lighter settings.
Why does my CPU bottleneck at 1080p but not at 4K?
The processor does about the same work per frame at any resolution, while the graphics card has far more pixels to draw at 4K. At 1080p a fast card finishes early and waits for the processor; at 4K the card becomes the slower part. That is why this calculator shows every resolution side by side.
Do gaming laptops have bottlenecks?
Yes, and they are harder to judge, because the same chip name runs at very different power limits in different laptops. Our table gives laptop chips their own, lower scores. You cannot swap laptop parts, so plug the laptop in, use the performance power mode and make sure games run on the dedicated graphics.
Can a bottleneck damage my PC?
No. A bottleneck only means one part waits for the other. Parts are not harmed by running at full load or by sitting partly idle. High temperatures are a separate issue worth checking if your frame rate drops over time.
Related tools
 FPS calculatorEstimated FPS in 60 games for your CPU, GPU and resolution
 GPU comparisonCompare two graphics cards: speed difference, VRAM and 60 gamesGPU tier listOver 240 graphics cards ranked on one scale: desktop, laptop and built-in
 PSU calculatorPower supply size, PC wattage and running costCan my PC run itCheck popular games against your graphics card, CPU and RAM, no downloadWhat GPU do I haveYour graphics card, read by the browser, with its tier and what it runs