This GPU tier list ranks 241 graphics processors on one scale: 159 desktop graphics cards, 37 laptop chips and 45 kinds of built-in graphics, from the GeForce RTX 5090 at the top to twenty-year-old cards at the bottom. Each card has a score where a GeForce GTX 1060 6GB is 100, so a card scoring 200 is roughly twice as fast in games. The scores are then cut into seven tiers, S to F, and each tier comes with what it can run: the resolution, the settings and the rough frame rate. Use it as a GPU hierarchy to see which cards are in the same class, as a graphics card ranking before you buy, or as a GPU comparison chart for your current card against an upgrade. Press Find my card and the list highlights the card your browser reports. For a closer look at two cards, the GPU comparison puts them side by side.
How does this GPU tier list work?
Every card gets one number: its average gaming performance relative to a GeForce GTX 1060 6GB, which is set to 100. We compiled the scores by hand from the manufacturers' specifications and the broad consensus of published gaming benchmark reviews at 1080p and 1440p, then rounded them, because two cards within about 10% of each other perform alike in practice. The tiers use fixed score boundaries, the same performance classes the Can my PC run it check prints:
- Tier S, enthusiast: score 480 and above.
- Tier A, high end: score 330 to 479.
- Tier B, upper mid-range: score 200 to 329.
- Tier C, mid-range: score 120 to 199.
- Tier D, older mid-range: score 60 to 119.
- Tier E, entry level: score 20 to 59.
- Tier F, basic: score 0 to 19.
Worked example: GeForce RTX 4060 against a GTX 1060
The RTX 4060 scores 215, so it is about 2.1 times as fast as a GTX 1060 6GB in an average game. That puts it in tier B, which starts at 200. Our frame rate model turns the score into an estimate: about 85 fps in recent AAA games at 1080p high settings and about 60 fps at 1440p, when the processor keeps up. The GTX 1060 lands at about 40 fps at 1080p in the same games. Against the published requirements of our 60 games, the RTX 4060 meets the recommended graphics card in 50 and the GTX 1060 in 19.
How to use the GPU tier list: step by step
Step 1: Start with the full ranking
The list opens with the 159 desktop graphics cards from NVIDIA, AMD and Intel, fastest first, grouped into tiers S to F.
Step 2: Filter to the cards you care about
Switch to laptop chips or built-in graphics, pick a brand, or type part of a name such as 4060 or 6600. More options adds the product family, a minimum amount of video memory and ray tracing.
Step 3: Find your own card
Press Find my card. The page reads the graphics card your browser reports and highlights it in the list without moving the page. If the browser hides it, type the name instead.
Step 4: Read the tier and the bar
Each bar is the card's score on our scale, where a GeForce GTX 1060 6GB is 100. The tier tells you what resolution and settings that class of card suits.
Step 5: Compare two cards
Open the GPU comparison to see two cards side by side, with the percentage difference and which of our games each one can run.
GPU tiers explained: what each tier can run
The frame rates are estimates from our model for the graphics card alone, in recent AAA games at high settings and in esports games at competitive settings. A slow processor lowers them, and single games can be half or double. The last column counts how many of our 60 games list a recommended graphics card that the cards in the tier meet.
| Tier | Examples | AAA 1080p | AAA 1440p | AAA 4K | Esports 1080p | Games at recommended |
|---|---|---|---|---|---|---|
| Senthusiast, 8 cards | GeForce RTX 5090, GeForce RTX 4090, GeForce RTX 5080 | 190+ | 130+ | 80+ | 820+ | 60 |
| Ahigh end, 20 cards | Radeon RX 9070, Radeon RX 7900 XT, GeForce RTX 4070 Ti SUPER | 130 to 190 | 90 to 130 | 55 to 80 | 560 to 820 | 59 to 60 |
| Bupper mid-range, 38 cards | GeForce RTX 5060 Ti, Radeon RX 6800, Radeon RX 7700 XT | 80 to 130 | 55 to 90 | 30 to 55 | 340 to 560 | 50 to 59 |
| Cmid-range, 36 cards | Intel Arc A750, Radeon RX 6600 XT, Radeon VII | 50 to 80 | 35 to 55 | 20 to 30 | 200 to 340 | 22 to 50 |
| Dolder mid-range, 48 cards | Radeon R9 Fury X, GeForce RTX 3050 6GB, GeForce GTX 1660 | 25 to 50 | 15 to 35 | 10 to 20 | 100 to 200 | 11 to 22 |
| Eentry level, 58 cards | GeForce GTX 770, GeForce GTX 680, GeForce GTX 960 4GB | 10 to 25 | 5 to 15 | 5 to 10 | 35 to 100 | 7 to 10 |
| Fbasic, 33 cards | Radeon HD 7750, Radeon R7 250, Radeon HD 4870 | 5 to 10 | 5 to 5 | 5 to 5 | 10 to 35 | 0 to 7 |
In short: tier S and A cards are for 1440p and 4K, tier B is the sweet spot for 1080p at high settings, tier C plays everything at 1080p with some settings lowered, and tiers D and E are for esports games and older titles. Tier F cards struggle with any recent 3D game.
GPU hierarchy chart: generations compared
Each new generation of mid-range card moves up the hierarchy. The chart follows the "60" class of NVIDIA cards and AMD's closest equivalent from about 2015 to 2025, on the same scale as the list.
The jump from the GTX 960 to the GTX 1060 was the biggest in this line, about 85%, and the GTX 1060 to RTX 2060 step was 55%. Since then the steps have been smaller: 19% from the RTX 2060 to the RTX 3060, 16% to the RTX 4060 and 23% to the RTX 5060 in our table. On the AMD side the Radeon RX 9060 XT moved further ahead of the RX 7600, and with 16 GB it also doubles the video memory.
NVIDIA vs AMD vs Intel graphics cards ranked
All three brands are on the same scale here, so you can read across them. The fastest desktop card of each brand in our table: GeForce RTX 5090 (820), Radeon RX 7900 XTX (520) and Intel Arc B580 (265). Intel's Arc cards sit in tiers B, C, D, AMD's Radeon RX 9070 XT and RX 7900 XTX reach tier S, and NVIDIA holds the top 3 places on its own. At the same score, the brands differ in other ways: NVIDIA cards tend to be faster with heavy ray tracing, AMD cards often have more video memory at the same price class, and Intel Arc cards depend more on a recent processor with Resizable BAR turned on. Use the Brand filter above to see each brand's full ranking.
Laptop GPU ranking: why laptop chips score lower
A laptop GPU with the same name as a desktop card is a different product: it runs at a lower power limit and often has fewer cores or less memory. That is why laptop chips have their own rows in this ranking. Switch Type to Laptop to see all 37.
| Name | Desktop score | Laptop score | Laptop vs desktop |
|---|---|---|---|
| GeForce RTX 3060 | 185 | 165 | -11% |
| GeForce RTX 3070 | 265 | 200 | -25% |
| GeForce RTX 4060 | 215 | 195 | -9% |
| GeForce RTX 4070 | 330 | 215 | -35% |
| GeForce RTX 4080 | 505 | 330 | -35% |
| GeForce RTX 4090 | 650 | 400 | -38% |
| GeForce RTX 5070 | 400 | 245 | -39% |
| GeForce RTX 5090 | 820 | 450 | -45% |
The gap grows at the top end, where desktop cards draw several hundred watts and a laptop cannot. Two laptops with the same chip can also differ by 20% or more, because each maker sets its own power limit; the laptop's spec sheet lists it as the maximum graphics power or TGP. A laptop RTX 4070 lands close to a desktop RTX 4060 in our table.
Integrated graphics ranking
Built-in graphics share the processor's power and the system memory, so most sit in tiers E and F. The newest AMD chips changed that. The ten fastest built-in graphics in our table, Apple aside:
| Built-in graphics | Score | Tier |
|---|---|---|
| Radeon 8060S | 230 | B |
| Radeon 890M | 82 | D |
| Radeon 880M | 70 | D |
| Radeon 780M | 67 | D |
| Intel Arc 140V | 65 | D |
| Radeon 680M | 57 | E |
| Intel Arc Graphics (built in, Core Ultra) | 55 | E |
| Radeon 760M | 55 | E |
| Qualcomm Adreno X1 | 40 | E |
| Radeon 660M | 40 | E |
For reference, a GeForce GTX 1650 scores 78 and a GTX 1050 Ti 63. Built-in graphics do best with fast dual-channel memory: a laptop with a single memory stick can lose a large part of this performance.
Apple M-series GPU ranking
Apple's chips have the graphics built in, and the Pro and Max versions have far more graphics cores than the base chip. On our gaming scale: Apple M4 Max 270, Apple M3 Max 215, Apple M2 Max 175, Apple M1 Max 150, Apple M4 Pro 140, Apple M3 Pro 110, Apple M2 Pro 100, Apple M1 Pro 85, Apple M4 80, Apple M3 68, Apple M2 58, Apple M1 45. The M4 Max lands in tier B, about level with a desktop RTX 5060 or Arc B580 on raw performance, but far fewer games run natively on macOS, so the score says more about the hardware than about what you can play.
Which GPU tier do you need for 1080p, 1440p and 4K?
- 1080p at 60 fps, high settings: tier B, or the top of tier C with some settings lowered. Examples: RTX 4060, RX 7600, Arc B580.
- 1080p at 144 fps or more: tier A or S for AAA games; esports games reach it from tier C.
- 1440p at 60 to 100 fps, high settings: tier A. Examples: RTX 4070, RTX 5070, RX 7800 XT.
- 4K at 60 fps: tier S, or tier A with upscaling such as DLSS, FSR or XeSS.
Your processor has to keep up as well, especially at 1080p and high frame rates. The bottleneck calculator shows which part limits first, and the refresh rate test tells you what frame rate your monitor can show.
How much VRAM do you need?
Video memory holds textures and other game data. When it runs out, games stutter or lower the texture quality on their own, however fast the chip is. 7 of the 60 games in our requirements list ask for a card with 8 GB or more at the recommended level, and 88 of the dedicated graphics in our table have 4 GB or less. As a rule of thumb: 8 GB is the minimum for new games at 1080p, 12 GB is comfortable at 1440p, and 16 GB or more suits 4K and heavy texture packs. The Video memory filter under More options narrows the list to cards with enough.
Graphics cards with ray tracing
89 of the dedicated graphics in our table support hardware ray tracing: every GeForce RTX card, Radeon RX 6000 and newer, and Intel Arc. A few games now require it, so a card without it fails those games however fast it is; the GTX 1080 Ti is an example. Our score is measured without ray tracing. With heavy ray tracing, NVIDIA RTX cards usually lose less performance than Radeon cards of the same score, and the newest Radeon RX 9000 cards narrowed that gap. Turn on Ray tracing only under More options to hide the others.
Why we built this GPU tier list
Most GPU rankings answer a narrower question than the one people bring to them. A typical GPU hierarchy article covers desktop cards only, so someone with an RTX 4060 Laptop GPU or Iris Xe graphics cannot find their chip, and synthetic benchmark charts rank cards by one test that is not a game. A ranking printed to the last percent also suggests that a gap of 3% matters, when single games often differ by far more than that. And a long list rarely tells you where your own card sits, or what a tier means for the games you play.
So this list puts 241 desktop, laptop and built-in graphics on one gaming scale, rounds the scores to the roughly 10% they are worth, and says what each tier can run at 1080p, 1440p and 4K. Find my card marks yours. Nitin Raja, who builds this site, compared a lot of GPU rankings before building this one, and kept what people use them for: where a card sits, what it can run, and how big the next step up is.
What this GPU tier list measures
One thing per card: average gaming performance without ray tracing, as a score where a GeForce GTX 1060 6GB is 100. The full method is under How does this GPU tier list work?. In short:
- The data. For each of the 241 graphics processors our table stores the score, the standard video memory, hardware ray tracing support, and whether it is a desktop card, a laptop chip or built-in graphics. The table was last checked in October 2026.
- The tiers. Fixed score boundaries, from tier S at 480 and above down to tier F under 20, so a card's tier only changes if its score does.
- The frame rates. Estimates from the same model as the bottleneck calculator, for the graphics card alone.
- The game count. Each card against the recommended graphics card of 60 games, from the publishers' own pages, checked in October 2026.
- Your card. Find my card reads the renderer name your browser reports through WebGL and matches it to the table.
It does not measure the card in your PC, ray tracing or frame generation performance, power draw, noise or price, and we run no lab tests: the scores are compiled from published reviews. For a live test of your own card, use the GPU benchmark.
How accurate is this GPU ranking?
It is good for classes and rough distances, not for single percentage points:
- Rounded on purpose. Cards within about 10% of each other should be read as equal. A card at 215 is not really faster than one at 205.
- One number for many games. The score is an average of typical gaming results at 1080p and 1440p. Individual games can favour one brand or one architecture by 20% or more.
- No ray tracing, no frame generation. Both change the picture in the games that use them.
- Laptops vary. The same chip runs at different power limits in different laptops.
- Old and rare cards are estimates from fewer sources than current ones.
- The frame rates above are model estimates, not measurements, and assume the processor does not limit.
Sources and method
- Specifications (video memory, ray tracing support, laptop and desktop variants) from the official pages of NVIDIA GeForce, GeForce laptops, AMD Radeon and Intel Arc.
- Performance: the broad consensus of published gaming benchmark reviews at 1080p and 1440p, compiled into our own scores by hand in October 2026 and rounded. No other site's table or database was copied.
- Game requirements: each publisher's own store or support page, listed on Can my PC run it.
- Frame rate estimates: the same model as the bottleneck calculator, which converts scores to typical frame rates per resolution.
Spotted a card that looks wrong or is missing? The contact page reaches us, and corrections go into the next update.
Why this GPU tier list is different
The table below compares the format with other rankings. A few more points it does not cover:
- Rounded on purpose. Cards within about 10% of each other count as equal, so the list does not crown a winner by a few percent.
- Tiers tied to real games. Each tier comes with frame rate estimates and the number of our 60 games whose recommended graphics card its cards meet.
- Your card only when you ask. Find my card does nothing until you press it, and the name it reads stays in your browser.
- Views you can share. The share link keeps the type, brand, filter text, family, video memory, ray tracing and sort settings, so "laptop chips with 8 GB or more" is one link.
- Method and date on the page. How the scores were made, what they leave out, and the month the table was last checked.
- Same numbers everywhere. GPU comparison, What GPU do I have and Can my PC run it read this table, so they never disagree with it.
This GPU tier list vs other GPU rankings
| This tier list | Typical GPU hierarchy article | Synthetic benchmark charts | |
|---|---|---|---|
| What the score is | Gaming performance, rounded, GTX 1060 6GB = 100 | Average fps or % in a set of tested games | One synthetic test, not games |
| Laptop and built-in graphics | Yes, 37 laptop chips and 45 built-in | Usually desktop cards only | Often mixed in with desktop cards |
| Tiers with what they can run | Yes, with resolution and frame rate estimates | Sometimes | No |
| Your card highlighted | Yes, read from the browser | No | No |
| Filters | Type, brand, family, video memory, ray tracing | Usually a static table | Search |
| Own lab tests | No, compiled from published reviews | Often yes | Yes, from user runs |
If you want measured frame rates for one specific game and card, a review that tested that game is the better source. If you want to see where a card sits among all the others, including the one in your own PC, this list is faster. Not sure which card you have? What GPU do I have tells you.
GPU tier list FAQ
What is the best graphics card in 2026?
On our scale the GeForce RTX 5090 is the fastest card, at 820, then the RTX 4090 at 650. For most people the more useful question is the best card for their screen: tier A cards like the RTX 5070 and Radeon RX 9070 handle 1440p at high settings, and tier B cards like the RTX 4060 and RX 7600 cover 1080p.
What is a GPU tier list?
A GPU tier list groups graphics cards into classes by gaming performance, from S for the fastest to F for the slowest, so you can see at a glance which cards perform alike. Ours places every card on one score scale first, then cuts the scale into seven tiers with fixed boundaries.
Is the RTX 4060 better than the RTX 3060?
Yes, a little. The RTX 4060 scores 215 and the RTX 3060 185, about 16% apart, which is a modest step. The RTX 3060 has 12 GB of video memory against 8 GB, which helps in some new games at high texture settings.
Where do laptop GPUs rank?
Laptop chips have their own rows, because they run at lower power than the desktop card with the same name. In our table they land 9% to 45% below that desktop card, with the biggest gaps at the top end. A laptop RTX 4070 scores about the same as a desktop RTX 4060.
Is integrated graphics good enough for gaming?
Older built-in graphics like Intel UHD sit in tier F and only suit very light games. The newest are far better: the Radeon 780M scores 67, not far below a GeForce GTX 1650 at 78, and the Radeon 8060S in Ryzen AI Max chips reaches 230, which is tier B.
How often is this GPU ranking updated?
The table was last checked in October 2026. New cards are added when they launch and when reviews give a clear picture of their performance; existing scores change only when new evidence moves a card by more than about 10%.
Why is my card lower than I expected?
The score is the average across many games at 1080p and 1440p. A card can do better than its score in games that suit it, or with a fast processor at 4K. Ray tracing is not part of the score, so RTX cards can pull ahead of Radeon cards in heavily ray traced games.
Related tools
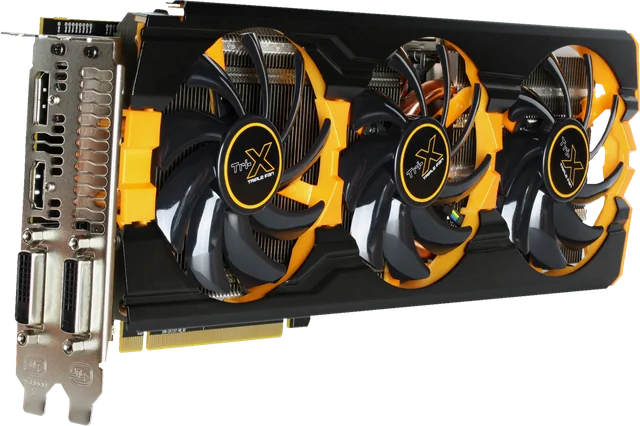 GPU comparisonCompare two graphics cards: speed difference, VRAM and 60 gamesWhat GPU do I haveYour graphics card, read by the browser, with its tier and what it runs
 Bottleneck calculatorWhich part limits first, CPU or GPU, at 1080p, 1440p and 4K
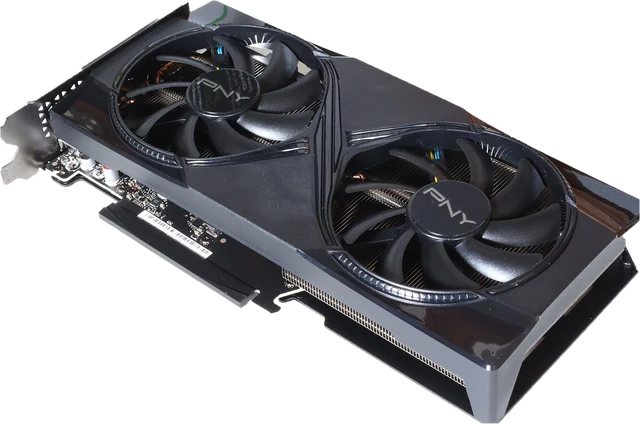 Can my PC run itCheck popular games against your graphics card, CPU and RAM, no download
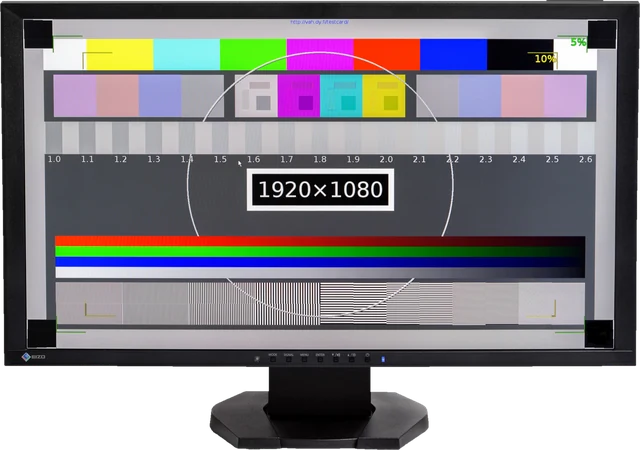 Refresh rate testYour monitor Hz, measured in the browser
 Monitor size calculatorScreen size in inches, PPI and aspect ratio