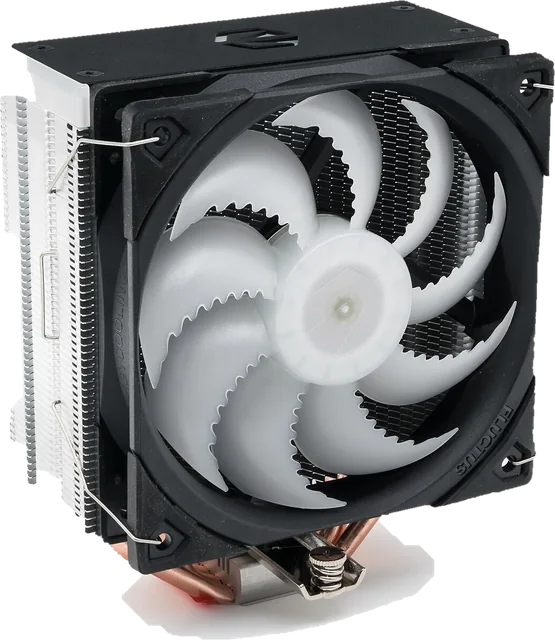
A CPU stress test keeps every core of your processor busy for several minutes to see whether it holds its speed and stays stable. This one runs in your browser with no download. It starts one Web Worker per logical processor (thread), each running the same fixed loop of arithmetic and memory work, and adds up how many loop steps all of them finish every second. Because the work never changes, throughput that falls over the minutes means the processor itself slowed down, which is what thermal or power throttling looks like from the outside. A bar per thread shows how the load spreads across performance cores, efficiency cores and hyper-threads. Use it as a quick CPU test or PC stress test after building a PC, replacing a cooler or thermal paste, or when a laptop gets slow under load. It is lighter than native tools such as Prime95, OCCT or Cinebench, and a browser cannot read temperature or clock speed, so the guide below names free tools to keep open next to it.
How does this CPU stress test work?
- Threads. The browser reports the number of logical processors through
navigator.hardwareConcurrency. All starts that many workers, Half starts half, One starts a single worker. The operating system decides which core each worker runs on. - The loop. Each worker runs a fixed loop forever: square roots and multiplications, integer shifts and multiplies, and for the mixed workload scattered reads and writes in a 256 KB table so the caches work too. About four times a second it reports how many loop steps it finished.
- The measurement. Every second the page averages each worker's reports and adds them up. That total, in million loop steps per second, is the line on the chart. The first 5 seconds are a warm-up and do not count in the comparison, because boost clocks and the JavaScript compiler settle there.
The unit is our own. It depends on the browser's JavaScript engine as well as the processor, so compare runs on the same PC and browser (before and after cleaning a cooler, plugged in and on battery), not between different PCs.
Worked example: a 3 minute run on Intel Core i7-12700H
The i7-12700H is a laptop processor with 6 performance cores (12 threads) and 8 efficiency cores (8 threads), 20 threads in total. With all 20 threads on the mixed workload, the median was 1,940 million steps per second. The first 30 seconds after warm-up had a median of 1,836 and the last 30 seconds 1,957, a change of +6.5%. Stable: the first seconds ran a little faster while the boost clock was fresh, then throughput settled and stayed level. The thread bars split into two groups, about 77 and about 119 million steps per second: the efficiency cores and the performance cores.
How to stress test your CPU: step by step
Step 1: Save your work and close heavy apps
The test uses every thread, so other apps slow down while it runs. Anything else that keeps the processor busy also lowers the result and hides throttling.
Step 2: Open a temperature monitor next to the browser
A browser cannot read CPU temperature or clock speed. Open HWiNFO, Core Temp or HWMonitor beside the browser window, or on a Mac a menu bar monitor, so you can watch both while the test runs.
Step 3: Pick a duration and the threads
All threads at 3 minutes is a good first check. Use 5 or 10 minutes to see whether the processor slows down once the cooler is fully warm. One thread shows single core boost behaviour.
Step 4: Press Start and keep the tab in front
The page starts one worker per thread, waits until all of them report, then starts the clock. Switching tabs stops the test.
Step 5: Read the verdict, the chart and the thread bars
The sentence on top says whether throughput held, eased or fell. Uneven bars are normal on processors with performance and efficiency cores. A line that slopes down at a fixed load means the processor got slower.
How to read the result
The verdict compares the median throughput of the first part of the run, after the warm-up, with the median of the last part. Each part is a fifth of the run, between 3 and 30 seconds. The same rules as our GPU stress test:
| What you see | Rule | What it usually means |
|---|---|---|
| Stable | End within 4% of the start | The cooler keeps up with a full load |
| Mostly stable | End 4% to 10% lower | Boost clocks settling as the processor warms up |
| Throttling | End 10% or more lower | A heat or power limit lowers the clock speed |
| Rose | End 10% or more higher | Another app was busy at the start |
| Drop | A second below 85% of the run's median | Short interruptions, usually other apps or the system |
| Uneven threads | Slowest thread under 70% of the fastest | Efficiency cores, hyper-threading or background work |
How long should you stress test a CPU?
For a health check, 3 to 5 minutes is enough to see throttling: an air cooler or a laptop heats up within a few minutes, and the chart shows the slope. Liquid coolers take longer, because the water warms up slowly, so run 10 minutes. For a new overclock or undervolt, this browser test is only a first check: run a native tool for 30 minutes to a few hours, then use the PC normally for a few days, since some errors only appear under particular loads.
Is it safe to stress test a CPU?
On a working PC, yes. Desktop and laptop processors measure their own temperature and slow down before they reach their limit. Intel lists a maximum junction temperature (TJunction) of 100 °C for the Core i9-14900K, and AMD lists a maximum operating temperature of 95 °C for the Ryzen 9 7950X; both chips are designed to boost until they reach those limits under heavy load. A stress test does not push a processor past what it allows. What it does is reveal problems: a loose or failed cooler, a pump that stopped, or an unstable overclock. Stop the test if the PC freezes, restarts or shows an error.
How to check CPU temperature while you test
A web page cannot read sensors. Keep one of these free tools open next to the browser:
- HWiNFO (Windows) shows every core's temperature and clock speed, plus power draw and whether a power or thermal limit is active.
- Core Temp (Windows) is a small window with the temperature of each core.
- HWMonitor (Windows) lists temperatures, voltages and fan speeds.
- Task Manager (Ctrl + Shift + Esc, Performance, CPU) shows the current speed in GHz and the load, but not the temperature.
- Linux: the
sensorscommand (lm-sensors) for temperatures andwatch -n1 "grep MHz /proc/cpuinfo"for clocks. - Mac: Activity Monitor shows load, and macOS has no built-in temperature readout; free menu bar monitors exist if you need one.
Throttling shows as the temperature reaching the chip's limit while the clock speed falls, at the same time as the chart slopes down. A clock that falls while the temperature is fine points to a power limit, which is common on laptops.
Why is my CPU throttling?
- Dust. A clogged heatsink or fan filter is the most common cause, especially in laptops. Clean it with compressed air.
- Cooler contact. A cooler that is not seated evenly, or old, dried thermal paste, cannot move heat away from the chip.
- Fans. A fan curve that keeps the fan slow under load, or a fan or pump that has stopped.
- Too small a cooler. High-end desktop processors can draw well over 200 W at full load (Intel allows the Core i9-14900K up to 253 W), more than a small stock cooler can handle.
- Power limits. Laptops on battery, small PCs and some motherboards cap the power the processor may draw.
- Room and case. A hot room, a PC in a closed cabinet, or a laptop on a bed or a sofa.
Laptop CPU stress test: what is different
Laptop processors run at much lower power limits than desktop ones and share a thin cooler with the graphics chip, so a laptop usually starts fast and settles lower after a minute or two. That first drop is designed behaviour, and the verdict may call it throttling when it is more than 10%. The real question is how far it falls. Run the test plugged in with the best performance power mode, then once on battery, and compare the charts: on battery the throughput is often much lower.
Performance cores, efficiency cores and hyper-threading
The thread bars are often uneven, and that is normal. Many Intel processors since the 12th generation combine performance cores (P-cores) with smaller efficiency cores (E-cores), and phone, Apple and many laptop chips do the same. Hyper-threading or SMT runs two threads on one core, so each gets less than a full core when both are busy. The operating system moves workers between cores during the run. A steady pattern of fast and slow bars is the chip's design; one bar that stays far below the rest when the others are even usually means another program is using that core.
Why we built this CPU stress test
Most people who stress test a processor want one answer: does it keep its speed once the cooler is warm? The well-known tools (Prime95, OCCT, Cinebench, AIDA64) are downloads. Prime95 and Cinebench show no temperatures of their own, and you read the graphs yourself to spot throttling. For a laptop that slows down under load, or a cooler you just replaced, that is a lot of setup before the first answer.
So this test loads every thread the browser reports with a fixed piece of work, plots the total every second and writes the verdict in plain words, using thresholds shown on this page. A bar per thread makes performance and efficiency cores visible, and the page is open about its limits: no sensors, and a lighter load than native tools. Nitin Raja, who builds this site, tried the usual CPU stress tools before building this one, and kept only what people need: every thread loaded, a chart over time and a verdict you do not have to work out yourself.
What this CPU stress test measures
The inputs are the duration (1, 3, 5 or 10 minutes), the threads (All, Half or One) and, under More options, the workload. The page reads the thread count from navigator.hardwareConcurrency and starts one Web Worker per chosen thread. Each runs a fixed JavaScript loop: square roots and sines for floating point, xorshift and Math.imul for integer, or both plus scattered reads and writes in a 256 KB table for mixed. Every worker times itself with performance.now() and posts its speed about every 250 ms; the page adds them up into one value per second, in million loop steps per second. The details are in how this CPU stress test works and the thresholds in how to read the result. The example chart above is our own run from October 2026, exported with the test's CSV button.
What it does not measure: temperature, clock speed, voltage or power draw, which browsers do not expose; calculation errors, which Prime95 and OCCT check for; the heavy AVX loads of native tools, which JavaScript cannot run; and which core each worker runs on, which the operating system decides. The unit depends on the browser's JavaScript engine, so it compares runs on the same PC, not different PCs.
How accurate is a browser CPU stress test?
The throughput is measured: each worker counts the loop steps it really finished. What a browser test cannot do:
- No sensors. No temperature, clock speed, voltage or power draw.
- Lighter than native tools. JavaScript cannot use instructions such as AVX-512 the way Prime95 or y-cruncher do, so native tools heat a processor more. A pass here does not prove an overclock is stable.
- Our own unit. Million loop steps per second depends on the browser's engine too, so it is not a benchmark score to compare between PCs.
- The browser may report fewer threads. Some browsers lower
hardwareConcurrencyfor privacy, so All may not load every thread. - Other apps count. Anything else busy on the PC lowers throughput and can look like a drop.
Why this CPU stress test is different
Each of these points can be checked on this page:
- Nothing runs until you press Start. No result is filled in beforehand, and the workers stop when the time is up, when you press Stop or when you switch tabs.
- The work never changes during a run, so a falling line can only mean the processor got slower.
- One bar per thread. Performance and efficiency cores show up as separate groups, as in our example run above.
- Published thresholds. Stable, mostly stable and throttling follow the rules in the table above.
- Honest about the unit. Million loop steps per second is our own measure, and the page says to compare runs on the same PC only.
- No account, nothing uploaded. The result stays on your device. When you copy it, it ends with a link that opens the test with the same settings, and that link never starts the test by itself.
This CPU stress test vs Prime95, OCCT and Cinebench
| This browser test | Native tools (Prime95, OCCT, Cinebench) | |
|---|---|---|
| Install | None, runs in the browser | Download and install |
| Load | Every thread, JavaScript arithmetic and cache work | Heavier, with AVX instructions and error checking |
| Error checking | No | Prime95 and OCCT detect calculation errors |
| Temperature, clocks, power | Not available in a browser | OCCT shows them; Prime95 and Cinebench need a separate monitor |
| Throughput over time | Yes, chart, thread bars and CSV | OCCT has graphs; Cinebench gives a score per run |
| Throttling verdict | Yes, from throughput at a fixed load | You read the graphs yourself |
| Phones, Macs, Chromebooks | Yes, any modern browser | Prime95 and Cinebench have Mac versions; phones need other apps |
| Cost | Free, no account | Prime95 and Cinebench are free; OCCT has a free tier |
A good order: this test first for a quick look, then Prime95, OCCT or Cinebench with HWiNFO open when you need proof of stability.
Sources
- MDN, navigator.hardwareConcurrency, Web Workers API and the Page Visibility API.
- Intel, Core i9-14900K specifications (TJunction 100 °C, maximum turbo power 253 W).
- AMD, Ryzen 9 7950X specifications (maximum operating temperature 95 °C).
Checking the whole PC? The GPU stress test does the same for the graphics card, and the bottleneck calculator shows whether your processor or graphics card limits games first.
CPU stress test FAQ
Is a CPU stress test safe?
Yes, for a working PC. Processors protect themselves: when they reach their temperature limit they lower the clock speed, and if cooling fails completely they shut the PC down. A stress test only shows how your cooling copes with a long full load. Stop it if the PC freezes or restarts, because that points to a problem worth fixing.
How long should I run a CPU stress test?
Three to five minutes shows whether the processor holds its speed once the cooler is warm. For a new build, an overclock or an undervolt, run a native tool such as Prime95, OCCT or Cinebench for 30 minutes or more, because rare errors and slow heat build-up need time to show.
Can a website stress test my CPU?
Yes. Web Workers let a page run code on several processor threads at once, and this test keeps every thread busy with a fixed loop for the time you choose. It is lighter than native tools, which use special instructions (such as AVX) and can draw more power, and a browser cannot read temperature or clocks.
What is a good CPU temperature during a stress test?
It depends on the chip, so check its official maximum. Intel lists a junction maximum of 100 °C for the Core i9-14900K and AMD a maximum of 95 °C for the Ryzen 9 7950X, and both are designed to run up to those limits under heavy load. Comfortably below the maximum is fine; at the maximum with falling clocks is throttling.
Why does my CPU throttle?
Most often heat: dust in the cooler, a fan that does not speed up, dried thermal paste, a cooler that is too small for the processor, or a laptop on a soft surface. Power limits also lower the clock, especially on laptops on battery and on small PCs.
Why are some threads slower than others?
Many recent Intel processors and phone and laptop chips mix fast performance cores with slower efficiency cores, and the operating system places the workers on both. Hyper-threading also shares one core between two threads. Uneven bars are normal; a single thread far below the rest can also mean another app is busy.
What does hardwareConcurrency mean?
navigator.hardwareConcurrency is the number of logical processors (threads) the browser reports, for example 16 on an 8-core processor with hyper-threading. Some browsers report fewer for privacy, so the number can be lower than your real thread count.
Is this the same as a CPU benchmark?
No. A benchmark gives a score to compare processors. This stress test measures whether your processor keeps the same speed over time, in its own unit that is only meaningful on the same PC. For an estimate of how your processor pairs with a graphics card, try the bottleneck calculator.
Related tools
 GPU stress testLoad your graphics card for up to 10 minutes and watch for throttling
 Bottleneck calculatorWhich part limits first, CPU or GPU, at 1080p, 1440p and 4K
 Can my PC run itCheck popular games against your graphics card, CPU and RAM, no download
 Keyboard testPress every key, with ISO, AZERTY and QWERTZ layouts
 Mouse testCheck every button, side buttons and the scroll wheel
 Ping testPing, jitter and lag to servers worldwide